The Developer's Guide to Reclaiming 50GB+ Without Deleting a Single Project File
Most developers who run out of disk space assume the fix involves deleting something they'll miss — old projects, photos, downloads they've been meaning to sort through. In practice, the biggest chunk of reclaimable space on a developer's Mac almost never lives in a file you'd recognize as "yours." It lives in dependency caches, build artifacts, and tool caches that get regenerated automatically the moment you need them again.
This is a full walkthrough of the six categories that, across dozens of developer machines, tend to account for the overwhelming majority of that space: JavaScript dependencies, Xcode build data, Docker's disk usage, Rust build output, package manager caches, and AI model weights — plus a note on duplicates, which sit slightly outside this list but are worth checking while you're at it. Every command below is one you can run and verify yourself before deleting anything.
None of this requires touching a single .ts, .swift, .rs, or .py file. That's the point — the goal is finding the 50GB or more that isn't source code at all.
Treat this as a reference you come back to rather than a one-time pass. Every category below regrows over time by design — that's how these tools are supposed to work — so the real value here is knowing exactly where to look and which command to run, whenever your disk starts feeling tight again.
Bookmark the command list as you go. The goal isn't memorizing every path on the first read — it's having a single place to come back to the next time df -h / comes back lower than you expected, instead of re-deriving each cache location from scratch.
Why source code was never the problem
It's worth being explicit about this, because it's the assumption that trips people up: the actual code you write is tiny. A large real-world project's source files might total a few tens of megabytes. Everything else in that project's folder — the compiled output, the downloaded dependencies, the IDE's cached build state — is regenerable, and it's routinely ten to a hundred times larger than the source it was built from. Once you internalize that ratio, cache cleanup stops feeling risky and starts feeling like the obvious first move.
This also explains why deleting old projects outright is usually the wrong first step. A project you haven't opened in a year might be 4GB on disk, but 3.8GB of that is a node_modules folder or a target/ directory you could clear in ten seconds without losing anything — the actual reason to delete the project folder (you'll genuinely never need it again) is a completely separate decision from the reason people usually reach for it (running low on space).
node_modules: the classic case, still the biggest for most people
Every npm install, yarn install, or pnpm install in a JavaScript or TypeScript project creates a node_modules folder that can range from a few hundred megabytes to well over a gigabyte, especially with modern frontend tooling and monorepos that duplicate transitive dependencies across packages.
Find every one on your disk with:
- find ~ -name node_modules -type d -prune -exec du -sh {} \; 2>/dev/null — lists every node_modules folder under your home directory with its size.
- Across a dozen cloned repos, half of which you haven't opened in months, this routinely adds up to 20-40GB.
- It's entirely safe to delete: running the install command again in that project folder rebuilds it exactly as it was, assuming the lockfile is still present.
- Monorepos make this worse in a specific way: tools like npm and Yarn workspaces hoist shared dependencies to a root node_modules folder, but per-package node_modules folders still appear for version-specific overrides, so a single monorepo clone can easily carry several gigabytes across half a dozen nested node_modules directories rather than just one.
Xcode's DerivedData and simulator leftovers
If you do any iOS, macOS, or Swift development, ~/Library/Developer/Xcode/DerivedData holds build intermediates, indexes, and cached build products for every project Xcode has ever opened — and it rarely cleans up after itself when you close a project.
Check its size with du -sh ~/Library/Developer/Xcode/DerivedData. It's common to find this at 15-30GB on a machine that's had Xcode installed for a year or more, most of it from projects you're no longer actively working on. Deleting the whole folder is safe — Xcode rebuilds whatever it needs the next time you open a project, at the cost of one slower initial index and build.
A second, often-overlooked spot is ~/Library/Developer/CoreSimulator/Devices, which holds every iOS/watchOS/tvOS simulator runtime and device you've ever created, including ones tied to Xcode versions you've since upgraded past. Run xcrun simctl delete unavailable to remove simulator devices tied to runtimes that are no longer installed — this alone can free several gigabytes without touching anything you're currently using.
A third spot worth checking if you build for physical iOS devices is ~/Library/Developer/Xcode/iOS DeviceSupport, which stores per-device debug symbol files for every iOS version you've ever connected a device running. Once you've moved past a given iOS version on your test devices, its folder here is safe to remove — Xcode re-downloads the matching symbols the next time it needs them.
Docker Desktop's disk image
Docker Desktop on macOS runs containers inside a lightweight Linux VM, and that VM's disk image is where every image layer, container filesystem, build cache layer, and unused volume actually lives. It grows readily and doesn't shrink on its own even after you delete containers and images inside Docker.
Start with docker system df, which breaks down exactly how much space images, containers, local volumes, and build cache are each using. From there, docker system prune -a --volumes removes everything not currently in use by a running container — this is the single biggest lever most developers never pull, since Docker doesn't prompt you to do it. It's worth reading the flag carefully before running it: -a includes images not referenced by any container, and --volumes removes unused volumes too, both of which are usually safe on a dev machine but will force a re-pull or re-build the next time you need those images.
If disk usage stays high even after pruning, check Docker Desktop's Settings → Resources → Advanced, where you can see and resize the virtual disk image itself, since the underlying file doesn't always shrink to match freed internal space without a compact step. Docker Desktop's own UI also has a Troubleshoot → "Clean / Purge data" option that resets the VM entirely, which is a heavier option worth knowing about if the disk image has grown far beyond what docker system df reports as actually in use.
Rust's target/ directories, one per project
Every Cargo project keeps its own target/ folder holding compiled dependencies and build artifacts, and because Rust compiles everything from source rather than using precompiled packages, this grows quickly — double-digit gigabytes isn't unusual for a project with a large dependency tree.
Find them all with find ~ -name target -type d -prune -exec du -sh {} \; 2>/dev/null, and clean any individual one with cargo clean run from inside that project. ~/.cargo/registry, which caches downloaded crate sources across all your projects, is worth checking too with du -sh ~/.cargo/registry — it's shared, so clearing it affects every project's next build, but all of it re-downloads automatically.
One detail specific to Rust that's easy to miss: debug builds keep full DWARF debug symbols, which can make target/debug considerably larger than target/release for the same project. If you only ever need release builds locally, running cargo build --release instead of the plain debug build day to day avoids accumulating a debug tree you're not using.
Package manager caches most people don't know they have
Beyond node_modules itself, each JavaScript package manager keeps its own separate global cache of downloaded package tarballs, meant to speed up future installs. These live in different places and are worth checking individually:
- npm — cache lives at ~/.npm. Check integrity and reclaim orphaned entries with npm cache verify, or clear it entirely with npm cache clean --force.
- yarn (classic) — cache lives at ~/Library/Caches/Yarn on macOS. yarn cache clean clears it; yarn cache dir shows the exact path in use.
- pnpm — uses a single global content-addressable store, typically at ~/Library/pnpm/store, shared across every project via hard links rather than duplicated per-project. pnpm store prune removes anything no longer referenced by an existing project.
Where all this manual checking gets tedious
By this point you've run six or seven different commands across six or seven different tools, each with its own cache location, its own cleanup command, and its own safe-to-delete caveats. None of it is individually hard, but doing it thoroughly — and remembering to come back and do it again in three months — is the part that actually falls off most people's radar.
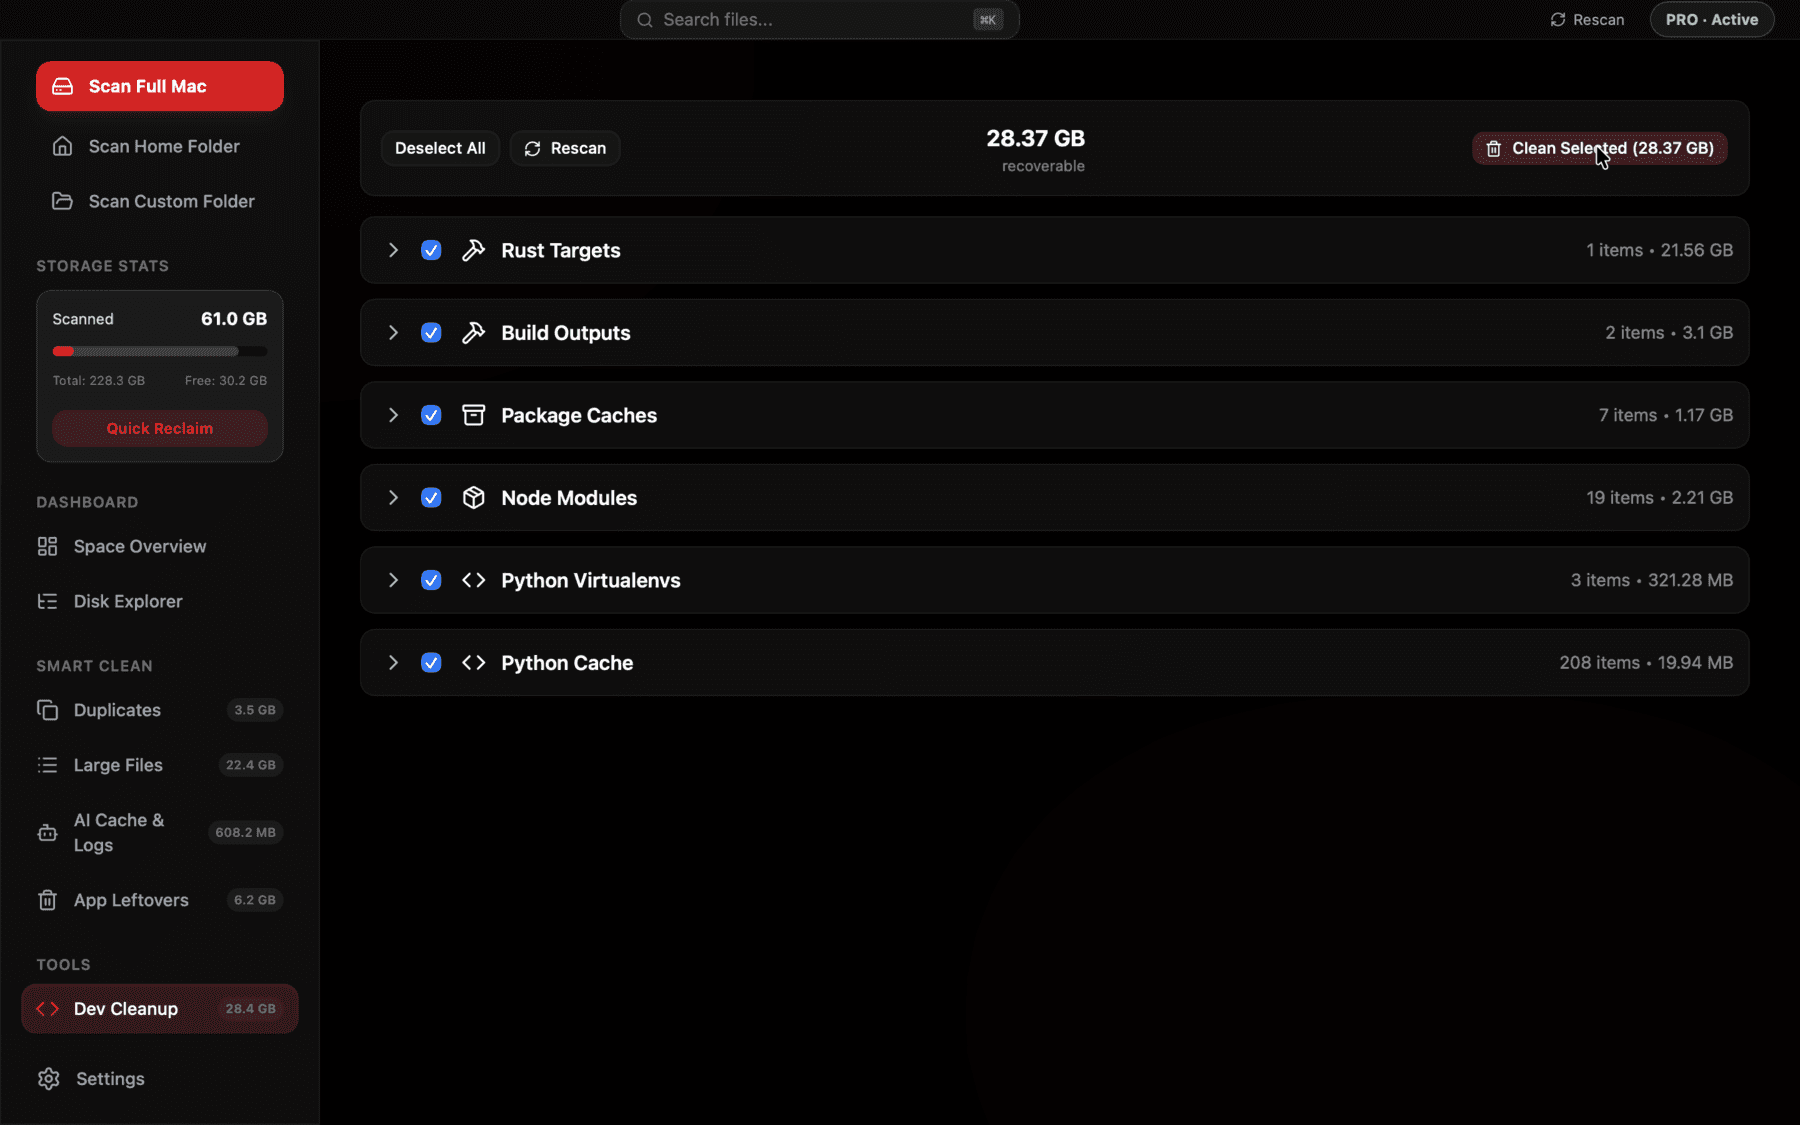
Scans for all of these categories at once — node_modules, Xcode DerivedData, Rust target/, Gradle and CocoaPods caches — grouped by type with a total, instead of one command per tool.
AI model weights and coding-assistant caches
If you run local models or use AI coding tools, this is often the newest and fastest-growing category, and for developers who've picked up local AI tooling in the last couple of years it can rival everything else on this list combined. Ollama stores downloaded models at ~/.ollama/models, and a handful of models you pulled to compare — a 7B, a 13B, maybe a larger one you tried once and forgot about — can easily total 30-60GB, since even quantized model weights routinely run 4-40GB per model depending on parameter count and quantization level.
LM Studio keeps its own downloaded model files in its app support directory, separate from Ollama's, so running both means paying the storage cost twice for any model you've pulled into each. The HuggingFace cache at ~/.cache/huggingface adds a third location if you've ever used a Python ML library like transformers or diffusers directly, since those download and cache model weights there independently of either app.
Separately, AI coding assistants like Cursor, GitHub Copilot, and similar tools maintain their own local caches, indexes, and logs that quietly grow the longer you use them — usually smaller individually than model weights, but worth a specific look if you've tried several of these tools side by side over time and kept them all installed. This is enough of its own category that it's worth checking on its own terms rather than folding it fully into this guide — Reclaim's AI Cache & Logs view is built specifically to break it down by tool, showing exactly which one is holding how much instead of a vague system total.
The one non-cache category worth a quick check: duplicates
Slightly outside the theme of this guide, but worth a mention since it's often sitting right next to everything above: exported build archives, downloaded installers you grabbed twice, and duplicate zips from old project backups tend to accumulate in the same Downloads and Documents folders developers already live in. Think of every .dmg installer you downloaded again because you couldn't find the first one, every archived export of a design file, every duplicate copy of a client deliverable saved "just in case" in two different folders. A duplicate finder that hashes files (cheap size comparison first, then a full hash on matches to confirm) will usually turn up a few more gigabytes here without any risk, since it's only ever flagging byte-identical files rather than guessing at similarity.
Verifying before you delete anything
A reasonable amount of caution here goes a long way, and it costs almost nothing in time. Before clearing anything, run the relevant du -sh or docker system df command and actually read the output rather than assuming — the whole point of this guide is replacing guesswork with real numbers. If a project is mid-build, skip it for this pass rather than clearing its cache while something's actively compiling. And if a Docker image or a node_modules folder belongs to a project you're not sure you're done with, deleting the cache costs you a rebuild, not the project itself — worst case, you pay a few minutes to regenerate it, which is a fundamentally different risk than deleting something irreplaceable.
Putting it together: a sensible order of operations
If you're doing this for the first time, check sizes before you clean anything, in roughly this order: Docker (docker system df), Xcode DerivedData (du -sh), your node_modules total (the find command above), Rust target folders, then the package manager caches, then AI model weights if you run any local models. Sizing everything first gives you a real number to weigh against the ten or fifteen minutes cleanup will cost you in slower next-build times — and it's common for that first pass alone to add up past 50GB on a machine that's been used for development for more than a year or two.
Once you've done a full pass this way, it doesn't need to become a monthly ritual. Docker and Xcode's caches are worth a glance every couple of months since they grow the fastest; node_modules and Rust target folders are more of a once- or twice-a-year check, since they're tied to specific projects rather than continuous background growth. Whichever cadence you settle on, the underlying method stays the same: check the real number before deciding, and clear caches instead of reaching for source files first.
The broader habit worth taking away from this is treating disk usage the same way you'd treat any other resource you monitor as part of doing the job well — not something you only look at once a year when Finder finally forces the issue with a full-disk warning, but a quick check you run the same way you'd check memory usage or CPU load, since the categories that eat space here are a direct byproduct of the tools you already use every day.
Frequently asked questions
How do I reclaim disk space as a developer without deleting my projects?
Target the regenerable caches instead of project files: node_modules, Xcode DerivedData, Docker's image and volume storage, Rust target/ folders, and package manager caches. All of these rebuild automatically the next time you install, build, or run the relevant tool.
What usually takes up the most space on a developer's Mac?
For most developers it's some combination of Docker Desktop's disk image, Xcode DerivedData, and accumulated node_modules folders across old projects — commonly 30-80GB combined on a machine used for more than a year.
Is it safe to run docker system prune -a?
Yes, in the sense that it only removes images, containers, and volumes not currently in use — but it does mean the next time you need one of those images, Docker has to re-pull or rebuild it. Check docker system df first so you know what you're clearing.
Will clearing npm, yarn, or pnpm caches break my projects?
No. These caches only speed up future installs by avoiding a re-download. Clearing them just means the next install in any project takes slightly longer while it re-fetches packages from the registry.
How much space can a developer typically reclaim doing this?
It varies by how long the machine has been used for development, but 50-100GB across Docker, Xcode, node_modules, and various tool caches is a realistic range for anyone who's been coding on the same Mac for a year or more without a cleanup pass.
Do I need to delete these caches manually every time, or can it be automated?
Some tools support scheduled or scripted cleanup (like cargo-sweep for Rust), but most of these caches have no built-in expiration, which is why periodically checking sizes yourself — or using a scanner that groups all of them in one view — is the practical approach.
See exactly what’s using your disk space.