I Audited Every Dev Tool on My Mac — Here's What Was Actually Taking Up Space
My Mac told me my disk was almost full on a Tuesday afternoon, mid-build, on a 1TB drive I was sure had plenty of room a few months earlier. Instead of guessing and deleting whatever looked old, I decided to actually audit it — tool by tool, with real commands, writing down every number before I touched anything.
This is that audit, with the actual sizes I found. Your numbers won't match mine exactly, but the categories almost certainly will — this is what a few years of normal development work looks like once you actually measure it instead of assuming.
I've been doing this job for about six years: mostly web and backend work, some iOS side projects, a couple of Rust CLI tools I've kept tinkering with, and Docker running more or less constantly since I containerize almost everything I build. None of that felt unusual to me going in, which is exactly why the final number surprised me as much as it did.
Starting point: df -h and a very unhelpful About This Mac
df -h / showed I had about 42GB free out of a 1TB internal drive — tighter than I'd realized. About This Mac → Storage broke it down into categories like "System Data" and "Other," neither of which told me anything actionable. "System Data" alone was reportedly over 200GB, which is the kind of number that tells you nothing about what to actually do next. That's what sent me to Terminal instead — if I was going to free up real space, I wanted to know exactly what I was clearing before I cleared it.
node_modules across every project I'd ever cloned
I ran find ~/Code -name node_modules -type d -prune -exec du -sh {} \; 2>/dev/null and let it sit for a minute. It came back with 34 separate node_modules folders. Most were a few hundred megabytes, but a couple of old monorepo clones were over 2GB each on their own. Total: 22GB, spread across projects going back roughly three years, several of which I hadn't opened since I cloned them.
The two biggest offenders were both freelance projects I'd finished and been paid for over a year earlier — I kept the repos cloned locally out of habit, in case a client ever came back with a question, but I'd genuinely never reopened either one. Those two alone accounted for close to 5GB of the total. I cleared both node_modules folders without a second thought; if either client ever does resurface, npm install takes a few minutes and I'm back exactly where I started.
Xcode DerivedData and forgotten simulator runtimes
du -sh ~/Library/Developer/Xcode/DerivedData came back at 18GB — unsurprising, I do iOS work occasionally and never clean this up. What surprised me was ~/Library/Developer/CoreSimulator/Devices: 9GB of simulator devices tied to iOS runtimes from two Xcode versions ago that I'd since upgraded past. Running xcrun simctl delete unavailable cleared most of that without affecting any simulator I actually use. Xcode total: 27GB.
I'd genuinely assumed DerivedData was more like 4-5GB before checking — I remembered it being small the first time I ever looked, years earlier, and had never revisited the assumption since. It's a good example of how a folder that's individually reasonable at any given moment can quietly become unreasonable over years without a single moment where it felt worth checking.
Docker Desktop's disk image
This was the biggest single number. docker system df broke it down as roughly 14GB in images, 11GB in build cache, and 6GB in volumes — 31GB of actual data, though the underlying VM disk image on disk had grown to over 40GB and hadn't shrunk back down even after previous cleanups. A handful of the images were from a client project I'd finished months earlier and never needed again. docker system prune -a --volumes brought the real data usage down substantially, though I kept a couple of images for a project I was still actively running containers for.
Build cache was the part that genuinely surprised me — 11GB of layers from Dockerfiles I'd rebuilt dozens of times over the past year, most of which weren't tied to any image I could still identify by name. Docker's layer caching is genuinely useful for speeding up rebuilds day to day, but it has no concept of "this project is done," so it just keeps accumulating cache for every build you've ever run until you tell it to stop.
Rust target/ directories from side projects
I only had four or five active Rust side projects, but find ~ -name target -type d -prune -exec du -sh {} \; 2>/dev/null still turned up 9GB total, with one CLI tool I'd been experimenting with alone accounting for almost half of that from a bloated dependency tree I'd since trimmed down but never rebuilt clean. Running cargo clean in that one project alone cleared over 4GB, and the next cargo build took about ninety seconds to fully recompile — a completely reasonable trade for the space.
Homebrew cache and npm's global cache
brew cleanup --dry-run showed old formula bottle downloads sitting in ~/Library/Caches/Homebrew that I'd never actually cleared — about 4GB of outdated package versions kept around after every upgrade, since brew upgrade doesn't remove the previous version's downloaded bottle by default. Separately, npm cache verify reported roughly 3GB in ~/.npm, unsurprising after years of installing and reinstalling dependencies across every JavaScript project I've touched. Neither of these felt significant on its own, which is exactly the pattern this whole audit kept turning up: small, individually forgettable numbers that only look meaningful once you add them to everything else.
Doing this manually took an entire evening
By the time I'd run all of the commands above, cross-referenced the outputs, and figured out what was safe to clear versus what I still needed, I'd spent close to two hours in Terminal across one evening — not because any individual command is hard, but because there's no single place that shows all of these categories together.
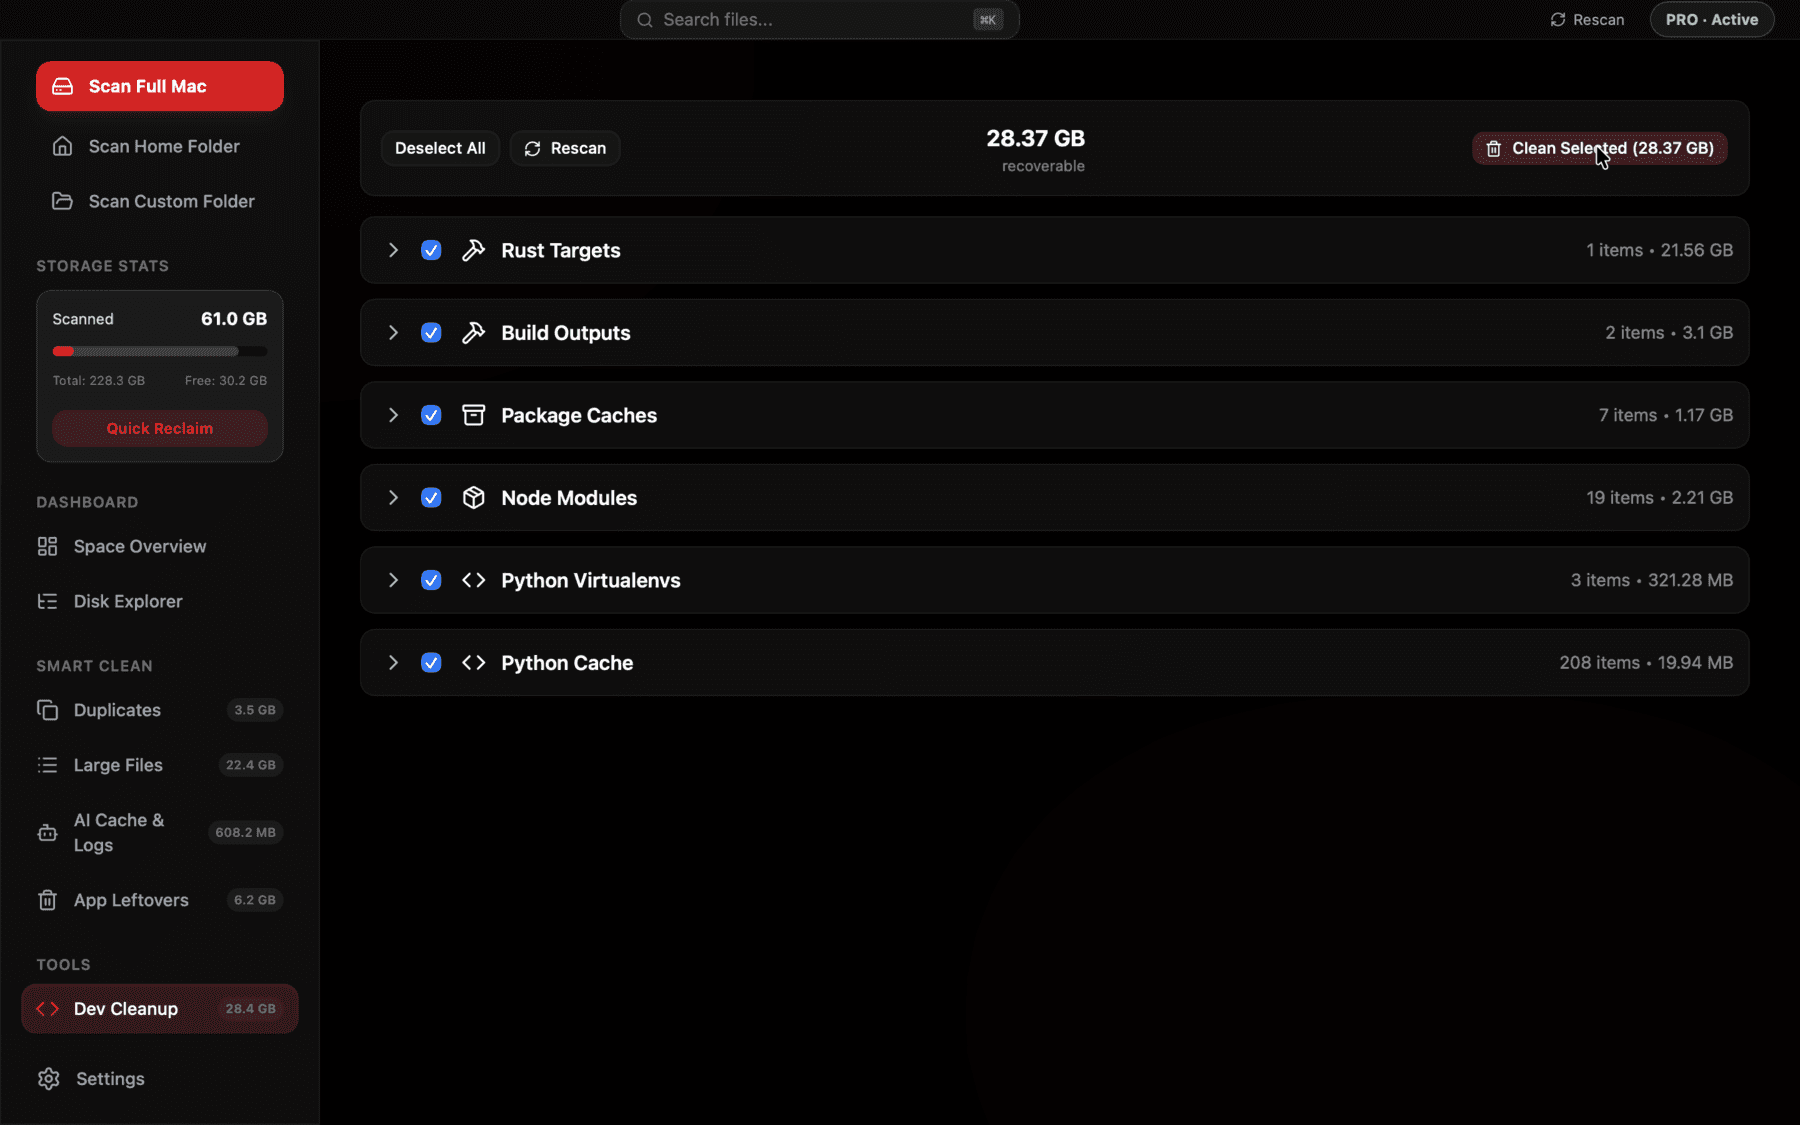
Would have shown me this entire breakdown — node_modules, Xcode, Docker, Rust target/, all grouped with sizes — in the time it takes to finish a disk scan, instead of an evening of individual commands.
Adding it all up
Here's the full tally from that audit:
- node_modules across old and active projects: 22GB
- Xcode DerivedData plus unused simulator runtimes: 27GB
- Docker images, build cache, and volumes: 31GB
- Rust target/ directories: 9GB
- Homebrew cache: 4GB
- npm global cache: 3GB
- Total: 96GB, none of it a project file, a photo, or anything I'd have thought to look for by browsing folders in Finder.
What I actually deleted, and what I left alone
I cleared essentially all of the node_modules folders for projects I hadn't touched in over a month, all the unavailable simulator runtimes, the unused Docker images and build cache, every Rust target/ folder, and both the Homebrew and npm caches. Everything went through Trash rather than a hard delete, which mattered more than I expected — I second-guessed one of the Docker images I'd pruned about a week later, and having it recoverable rather than gone would have saved me a slow rebuild if I hadn't already emptied Trash by then.
I deliberately left a couple of node_modules folders alone for projects I was actively switching between, since regenerating them mid-sprint just to save a few hundred megabytes wasn't worth the wait. I also left the Ollama models I was actively using for a side project alone entirely — that's a different category from the six above, and worth its own separate check if you run local AI tools, since model weights can dwarf everything on this list.
What I'd do differently next time
The main lesson wasn't any individual number — it was that none of this had a natural trigger to prompt me to check it. Nothing warns you when Docker's disk image doubles, or when your fourth abandoned side project's target/ folder hits 4GB. Doing a version of this audit every few months, rather than waiting for a low-disk-space warning to force the issue, would have kept the total from ever reaching 96GB in the first place.
The other thing I'd do differently is stop assuming any one tool is the culprit before I actually check. Going in, I would have guessed node_modules was the biggest offender by a wide margin, just because it's the one I've heard complained about most over the years. It wasn't even close — Docker and Xcode combined were nearly two and a half times bigger. I'd rather have a real number for each category than a hunch about which one to blame, and now that I've done this once, checking again in a few months is a five-minute pass instead of a two-hour one, since I know exactly where to look.
If you've never done this on your own machine, I'd genuinely recommend setting aside twenty minutes for it, even if you're confident you already know your biggest offender. I was confident too, and I was wrong about which category actually topped the list.
Frequently asked questions
How much disk space do dev tool caches typically use on a Mac?
It varies widely, but 80-140GB combined across node_modules, Xcode DerivedData, Docker, and language-specific build caches is realistic for a developer machine used actively for a year or more without cleanup.
What usually takes up the most space: node_modules, Docker, or Xcode?
In this audit, Docker's images, build cache, and volumes were the single largest category at 31GB, followed by Xcode DerivedData and simulator runtimes at 27GB, then node_modules at 22GB — but the exact ranking depends heavily on what kind of development you do.
Is it safe to delete old Docker images and unused simulator runtimes?
Yes. Docker images not referenced by a running container re-pull or rebuild automatically when needed, and simulator runtimes tied to old Xcode versions can be recreated by reinstalling that runtime if you ever need it again.
How often should I audit dev tool storage on my Mac?
Every few months is reasonable for an actively used development machine, since none of these caches have a built-in size limit or automatic expiration.
Why doesn't Finder show any of this when I browse my folders?
Most of it lives inside hidden or rarely-browsed locations like ~/Library/Developer, ~/.cargo, and ~/.npm, or inside project folders you haven't opened recently — none of which show up when scrolling through Applications or Documents looking for something obvious to delete.
What's the safest order to clean these caches in?
Check sizes with du -sh or docker system df before deleting anything, start with the categories you're least likely to need again soon (old project node_modules, unused simulator runtimes), and use a tool that moves items to Trash rather than deleting permanently in case you second-guess a choice later.
See exactly what’s using your disk space.