How Much Disk Space Do AI Coding Assistants Actually Use? We Checked.
Every AI coding tool gets lumped into the same vague complaint — "these things eat disk space" — but that's not equally true of all of them, and treating them as one category leads to the wrong cleanup decisions. Some AI coding assistants run entirely against a cloud API and leave behind little more than logs and a small local index. Others actively index your whole codebase into a local vector store, or bundle an optional local completion model, and those genuinely do add up.
We looked at what each of the common tools actually writes to disk on macOS — not what they claim, what's actually sitting in Application Support and Caches after normal use across a handful of active projects over several weeks.
The comparison
Sizes below are typical ranges after a few weeks of regular use on a handful of active projects, not worst cases:
- Cursor — roughly 1-4GB — Electron app cache plus a local index of embeddings for codebase context on open projects, stored per-workspace; grows with the number and size of projects you've opened.
- GitHub Copilot (VS Code extension) — tens of MB — no local model or index; inference is entirely cloud-side, so what's left behind is just extension logs and small telemetry caches.
- Windsurf — similar to Cursor, roughly 1-3GB — also builds a local codebase index for its agentic features, stored alongside its Electron app cache.
- Continue (VS Code/JetBrains extension) — tens of MB by default, but no ceiling if you point it at a local model — Continue itself is a thin client; if you configure it to call Ollama or LM Studio for local inference, the multi-gigabyte cost belongs to that model runner, not to Continue.
- Sourcegraph Cody — tens of MB — cloud inference and a lightweight local context cache; no local model weights.
- Tabnine — a few hundred MB to several GB, depending on configuration — Tabnine is one of the few that ships an actual local completion model as an option; if you've enabled local/private mode, that model's weights are the majority of its footprint.
- Codeium — tens of MB — cloud-based, comparable to Copilot's footprint.
- Aider — negligible on its own (it's a CLI tool with no persistent app cache) — but it's commonly paired with a local model through Ollama, in which case the multi-gigabyte cost is Ollama's, not Aider's.
The pattern worth noticing
The split isn't really about which company made the tool — it's about whether inference happens locally or against an API. Copilot, Cody, and Codeium keep almost nothing on disk because the model doing the work isn't on your machine at all. Cursor and Windsurf sit in the middle: their chat inference is cloud-based too, but both build and maintain a local semantic index of your codebase to support features like multi-file context, and that index is real, ongoing disk usage that scales with how many projects you keep open in them. Tabnine and any setup using Continue or Aider with a local model are the only cases here where you're storing actual model weights, and that cost is identical to running Ollama or LM Studio directly — because in most cases, that's literally what's underneath.
What a codebase index is actually made of
It helps to know what's inside that 1-4GB Cursor or Windsurf figure, since "index" undersells how much is actually stored. When you open a project, these tools chunk your source files (usually by function or logical block rather than fixed line counts), generate an embedding for each chunk, and store both the vectors and enough metadata to map a match back to a specific file and line range. For a mid-size codebase — say 50,000 lines across a few hundred files — that can produce tens of thousands of chunks, and the resulting index commonly lands between 200MB and 800MB per project depending on chunking granularity and whether the tool also caches parsed syntax trees for faster re-indexing.
The part that surprises people: this index is retained per project, and reopening a project after weeks away doesn't discard the old index — it either reuses it or updates it incrementally. That means a developer who's opened even fifteen or twenty different repositories in Cursor over six months — including short-lived clones, tutorial repos, and abandoned side projects — can be storing that many separate multi-hundred-megabyte indexes simultaneously, most of which will never be opened again.
A closer look at Tabnine's local mode
Tabnine is worth calling out specifically because its footprint is bimodal rather than a single consistent number. In its default cloud configuration, it behaves like Copilot — tens of megabytes, mostly logs and settings. Switch it to local or air-gapped mode, intended for teams with strict code-privacy requirements, and it downloads a dedicated completion model sized for on-device inference, commonly in the 1-4GB range depending on the model tier selected. That model lives under Tabnine's own Application Support folder rather than in an Ollama or LM Studio store, which means it's easy to miss during a general AI-cache audit if you're only checking the well-known model runners.
What monorepos do to this number
Everything above assumes reasonably normal-sized projects. Monorepos change the math meaningfully, because a codebase index generally scales with total file count and code volume in the workspace, not with how much of it you actually touch day to day. A monorepo containing a dozen services, each with its own dependency tree checked into the repo or vendored locally, can push a single project's index well past a gigabyte on its own — closer to the size of two or three ordinary projects combined. If you work primarily in one or two monorepos, it's entirely possible for those alone to account for most of Cursor's or Windsurf's total footprint, with every smaller side project contributing only a rounding error by comparison.
This also means the per-project index size isn't a reliable signal of how large the underlying source actually is, since most of these tools exclude common non-source directories (node_modules, build output, .git) from indexing by default — but not always consistently across every language and monorepo layout, so it's worth spot-checking a large project's index size against what you'd expect from its source alone if the number looks surprising.
Logs and telemetry: small individually, worth naming precisely
It's worth being precise about the "tens of MB" figure for cloud-inference tools like Copilot, Cody, and Codeium, since "small" can still mean different things. In practice this usually breaks down into a rotating extension log (a few MB, capped and overwritten rather than growing indefinitely), a small telemetry queue of usage events waiting to be sent or already sent, and cached completion suggestions kept briefly for the current session. None of these categories is designed to accumulate — they're either capped by the extension itself or cleared on VS Code restart — which is the real reason these tools stay small over time rather than just starting small and growing slowly. That's a structural difference from Cursor's or Windsurf's index, which is explicitly designed to persist and grow as you use more projects.
Checking this on your own machine
A few commands to see what your own setup is actually holding:
- `du -sh ~/Library/Application\ Support/Cursor` and the equivalent for Windsurf — shows the app cache plus its codebase index directories.
- `du -sh ~/.continue` — Continue's config and any local cache it maintains, separate from whatever model runner it's pointed at.
- `du -sh ~/.ollama/models` — check this regardless of which coding assistant you use, since several of them silently route to a locally running Ollama instance if one is configured.
- `code --list-extensions` combined with checking `~/.vscode/extensions/*/` sizes — surfaces which VS Code AI extensions have grown unexpectedly large.
- `du -sh ~/Library/Application\ Support/Tabnine` — worth a specific check if you've ever enabled local/private completion mode, since that model won't show up in an Ollama or LM Studio audit.
- `find ~/Library/Application\ Support/Cursor -maxdepth 3 -type d -name "*index*" -exec du -sh {} \;` — a more targeted way to see index size broken out per project rather than the app's total footprint.
Cursor's index growth is the one to actually watch
Of everything covered here, the codebase index that Cursor and Windsurf maintain is the one most likely to surprise you, because it grows quietly in the background every time you open a new project, and it isn't cleared when you close a project — only when you explicitly remove it or uninstall the app. If you've opened dozens of repositories in Cursor over several months, some of them abandoned side projects, that index history is a real and recoverable chunk of space. A useful gut check: if your Cursor Application Support folder is larger than 2-3GB and you can't name more than five or six projects you've actively worked in during the last month, most of that size is likely stale project indexes rather than anything currently useful.
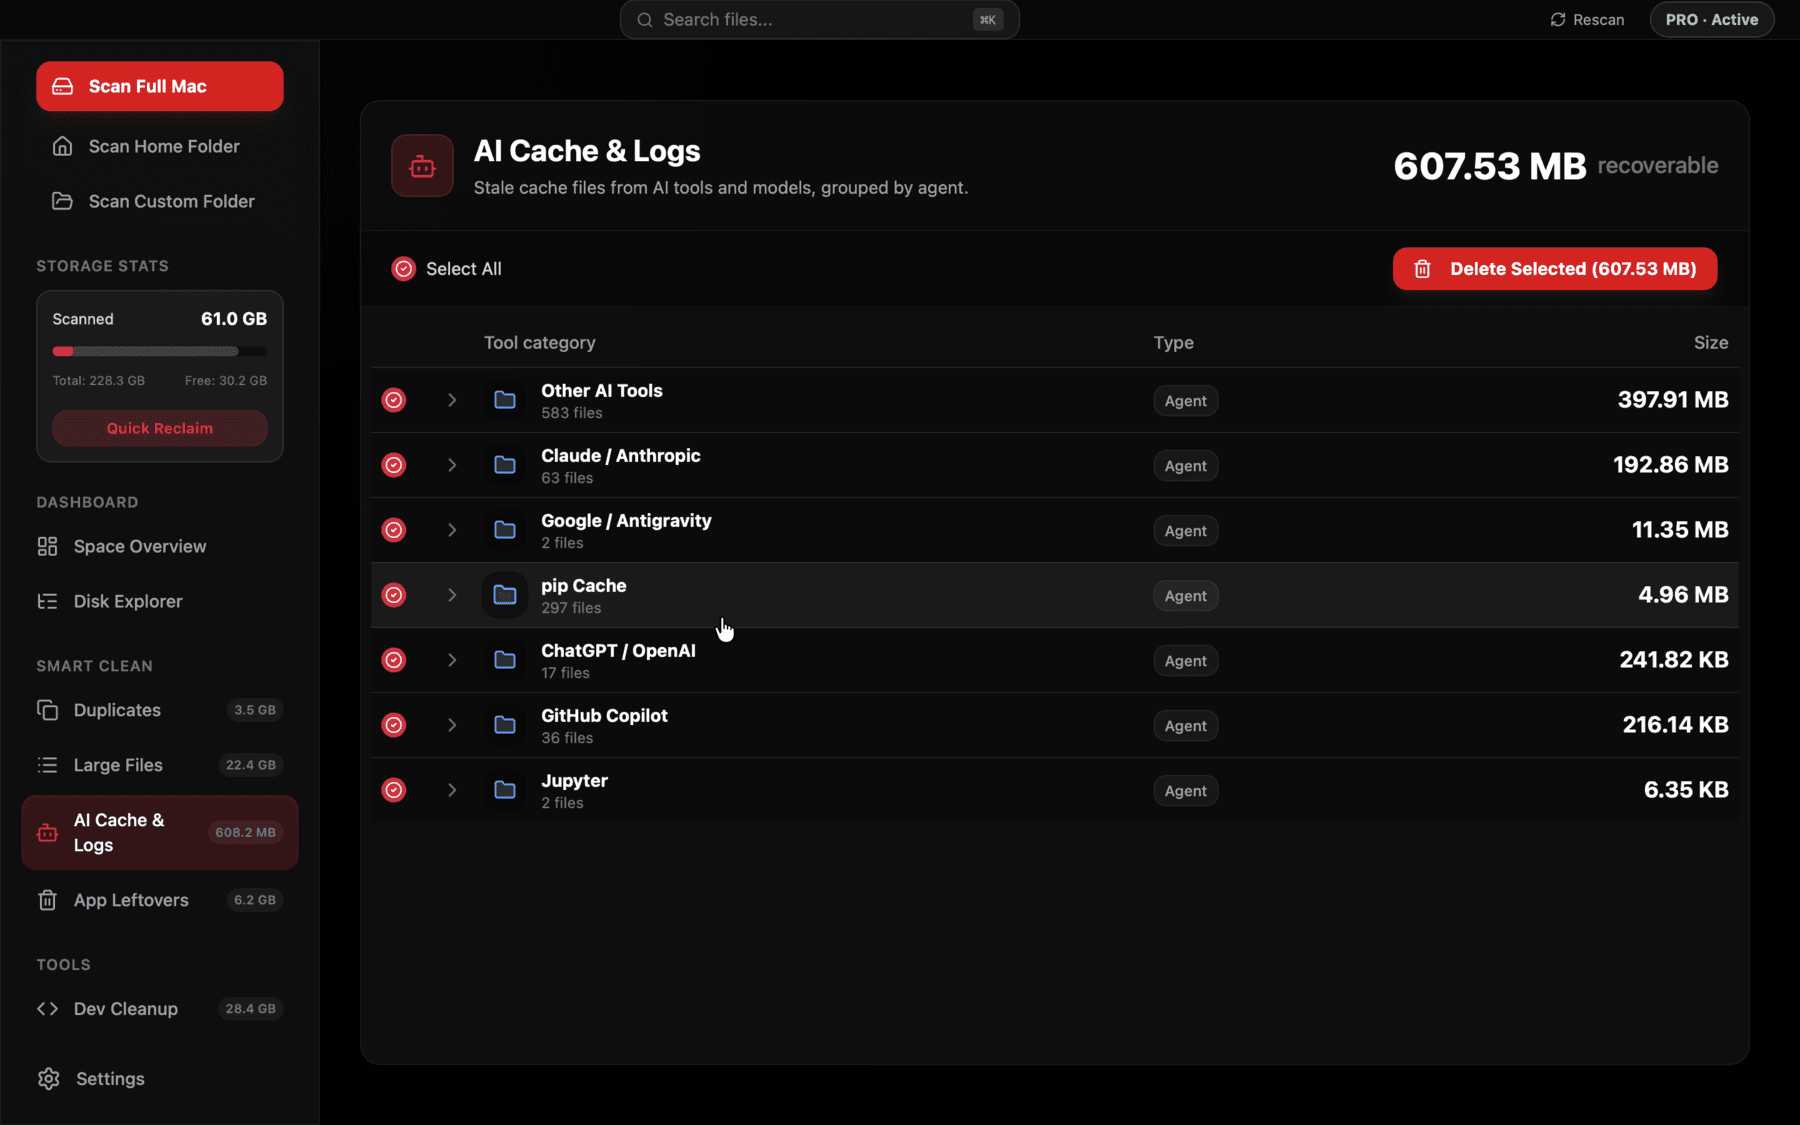
Reclaim's AI Cache & Logs view lists each recognized AI coding tool separately with its actual measured size, so you can tell a genuinely large local index apart from a tool that was never storing much to begin with.
The honest takeaway
If you're trying to free up space and you're using Copilot, Cody, or Codeium, there's not much to reclaim there — they were never the source of the bloat. If you're using Cursor, Windsurf, or Tabnine's local mode, or you've configured Continue or Aider against a local model, that's where to actually look, and in the last case, cleaning up is really about managing your Ollama or LM Studio model store rather than the coding extension itself. Knowing which category your setup falls into before you start deleting things saves you from clearing a tiny extension cache and being disappointed, or from ignoring a multi-gigabyte index because you assumed all AI coding tools were equally lightweight.
Frequently asked questions
Does GitHub Copilot store a local AI model on my Mac?
No — Copilot's completions come from a cloud API, so it leaves behind only small extension logs and telemetry, not model weights.
Why does Cursor use more disk space than GitHub Copilot?
Cursor builds and maintains a local semantic index of each codebase you open to support multi-file context features, on top of its normal app cache — Copilot has no equivalent local index.
Is Tabnine's local mode worth the extra disk space?
It depends on whether you need completions to run fully offline or privately — that mode trades roughly 1-4GB of local model weights for not sending code to a cloud API.
If Aider is so small, why is it using 10GB of disk space on my machine?
Aider itself isn't — check whether you've configured it against a local Ollama or LM Studio model, since that model's weights are what's actually consuming the space.
How do I clear Cursor's codebase index without losing my settings?
Cursor's per-project index lives separately from its settings and account data inside its Application Support folder; removing old project index folders there clears the index while leaving your configuration intact.
Does opening a project in Cursor or Windsurf every reduce its index size over time?
No — reopening a project reuses or incrementally updates its existing index rather than shrinking it, and closing a project doesn't delete its index either, which is why old, abandoned projects can account for most of an inflated Application Support folder.
See exactly what’s using your disk space.